
ATO benchmarks Australia are financial ratios published by the Australian Taxation Office to help businesses compare their income and expenses with typical results from similar businesses in the same industry. These benchmarks are widely used by accountants, tax agents, and regulators to evaluate whether a business’s reported figures look reasonable compared with industry averages.
For Australian small business owners, understanding these benchmarks is important when preparing tax returns, reviewing financial performance, and managing compliance risk. When business ratios differ significantly from industry norms, it may signal errors in reporting, unusual business structures, or potential tax compliance issues.
What Are ATO Benchmarks in Australia?
ATO benchmarks Australia are statistical ranges derived from financial data submitted by businesses in their Tax Returns and Business Activity Statements (BAS). These benchmarks allow the Australian Taxation Office (ATO) to compare the financial performance of individual businesses against industry averages.
According to the Australian Taxation Office, industry benchmarks are financial ratios calculated from tax return and activity statement data, helping the regulator analyse business activity and identify businesses that significantly differ from industry norms.
The main purpose of ATO industry benchmarks is to promote voluntary compliance and help both the ATO and business owners identify unusual financial patterns before they become tax compliance issues.
Why the ATO Uses Industry Benchmarks
The Australian Taxation Office developed ATO industry benchmarks as a tool to improve tax compliance and identify inconsistencies in business reporting. ATO indicates that benchmark ratios help regulators identify unusual financial patterns that may suggest errors or underreported income.
The benchmarks serve several purposes:
- Detect businesses with income or expenses outside normal industry ranges
- Identify incorrect deductions or underreported turnover
- Improve voluntary compliance among small businesses
- Protect honest businesses from unfair competition
The ATO also uses benchmark analysis as part of broader compliance monitoring systems that compare business data across industries and income ranges. Ultimately, ATO benchmarks Australia help ensure that businesses reporting similar activities produce reasonably consistent financial results.
What Are ATO Benchmark Ratios?
ATO benchmark ratios are financial metrics used to compare a business’s financial performance against similar businesses within the same industry. Rather than focusing on raw dollar values, the ATO uses ratios to assess whether financial patterns look typical. For example, two restaurants may have very different revenues but still share similar cost and profit ratios.
According to the ATO’s benchmarking methodology, ratios derived from tax return data commonly include gross profit ratios, expense-to-turnover ratios, wage-to-turnover ratios, and net profit margins.
Typical ATO benchmark ratios include:
- Gross profit ratio
- Net profit ratio
- Labour cost to turnover
- Cost of sales to turnover
- Total expenses to turnover
These ratios allow regulators and tax professionals to compare business performance across thousands of similar businesses, helping identify patterns that may indicate reporting errors or tax compliance risks.
Types of ATO Industry Benchmarks Used in Australia
The ATO publishes five official benchmark ratios, each expressed as a percentage of turnover (excluding GST). Businesses are compared against others in the same industry and turnover range.
Cost of Sales to Turnover
Compares the cost of producing goods or services against total turnover.
Formula: Cost of Sales ÷ Turnover × 100
The ATO excludes salary and wages from the cost of sales figure. If a business has included wages within the cost of sales on the tax return, the ATO deducts them before applying the formula. A ratio significantly above the industry range may indicate inefficient purchasing, while a very low ratio could suggest unreported income.
Total Expenses to Turnover
Measures the proportion of revenue consumed by operating expenses.
Formula: (Total Expenses − Payments to Associated Persons) ÷ Turnover × 100
The ATO removes payments to associated persons from total expenses before calculating this ratio.
Labour to Turnover
Measures the combined cost of wages and contractors relative to total revenue.
Formula: (Total Salary and Wages + Contractor/Subcontractor/Commission Expenses − Payments to Associated Persons) ÷ Turnover × 100
If the W1 label on the activity statement shows a higher wages figure than the tax return, the ATO uses the activity statement amount. This benchmark is particularly relevant in hospitality, construction, and personal services.
Rent Expenses to Turnover
Applies only to businesses that incur rent costs.
Formula: Rent Expenses ÷ Turnover × 100
Example: $36,000 rent ÷ $180,000 sales × 100 = 20%
A higher ratio is expected for businesses in city locations. If your ratio is unusually low, the ATO may check whether rent is paid to a related party below market rate.
Motor Vehicle Expenses to Turnover
Applies to businesses with motor vehicle costs, particularly relevant in trades, delivery, and field services.
Formula: Motor Vehicle Expenses ÷ Turnover × 100
If your ratio sits above the industry range, maintain a compliant logbook to support the business-use claim.
Turnover Benchmarks
Where a business is purchasing significant stock and paying wages, the ATO expects reported sales to reflect that level of activity. If records are incomplete, the ATO can use benchmark data to estimate expected revenue and issue a tax assessment based on that figure. Keeping accurate sales records is the most effective protection against an estimated assessment.
How ATO Industry Benchmarks Work in Practice
How the ATO Collects Benchmark Data
The ATO develops ATO industry benchmarks using several data sources:
- Business Tax Returns
- Business Activity Statements (BAS)
- Industry classification codes
- Financial statistics and economic data
According to the ATO, benchmark ratios are derived from tax return information submitted by individuals, companies, partnerships, and trusts across Australia. The Australian Bureau of Statistics also provides economic and industry performance data that helps validate broader industry patterns.
Industry Comparison Process
Once the ATO collects financial data, businesses are grouped using Business Industry Codes. Each business is then compared with others in the same industry category.
Benchmarks are often segmented by:
- Industry type
- Turnover range
- Business structure
- Profitability
This segmentation ensures comparisons are meaningful and relevant.
Identifying Outliers
Businesses whose financial ratios fall significantly outside benchmark ranges may be flagged as statistical outliers. However, the ATO emphasises that benchmarks are only indicators and should not be used in isolation when evaluating tax compliance.
Compliance Monitoring
Benchmark analysis is part of the ATO’s broader compliance monitoring framework. It works alongside:
- Data matching programs
- Third-party reporting
- BAS reconciliation checks
- Tax return analytics
ATO Audit Risk Benchmarks Explained
ATO audit risk benchmarks refer to benchmark ratios used to identify potential compliance risks during tax analysis.
What Triggers an ATO Audit Attention
Several patterns may trigger closer review:
- Income significantly lower than industry averages
- Expense ratios outside typical ranges
- Unusual profit margins
Benchmark Red Flags the ATO Monitors
Common indicators include:
- Very low reported turnover relative to expenses
- Extremely high deductions
- Profit margins inconsistent with industry data
Risk Scoring and Data Matching Programs
The ATO uses data-matching programs to compare information from multiple sources, including banks, employers, and government agencies. The Inspector-General of Taxation notes that modern compliance programs rely heavily on analytics and cross-agency data matching to identify anomalies.
When Businesses Fall Outside Benchmark Ranges
Falling outside a benchmark range does not automatically trigger an audit. Many legitimate reasons may explain variations, including:
- Unique business models
- Regional cost differences
- Startup expenses
The ATO itself states that benchmarks should not be used as the sole indicator of compliance risk. For a deeper look at how the ATO audit process works and what to expect, see our tax audit guide for 2026.
How Benchmarks Trigger Reviews or Audits
Benchmarks are an early signal, not a final decision. When anomalies appear, the ATO may:
- Request additional documentation
- Conduct a risk review
- Perform a full audit in rare cases
How Benchmarks Affect Business Tax Returns
When you lodge a Tax Return, the ATO compares your figures against typical ranges for your industry. Ratios that sit well outside the norm may prompt a closer look.
Income Reporting Checks
If your reported turnover looks low relative to your staffing levels or expense claims, the ATO may request bank statements or sales records to confirm all income has been captured.
Expense Validation
Each industry has a typical range for costs like wages, rent, and stock. Claims significantly above or below that range may prompt the ATO to request supporting documents. Maintaining accurate records throughout the year through good bookkeeping makes this straightforward if questions arise.
Profit Margin Comparison
A gross profit margin well below the industry average may suggest costs are overstated or some sales are missing. An unusually high margin can indicate legitimate expenses have been missed, which increases your tax bill unnecessarily.
How to Check ATO Benchmarks for Your Industry
Using the ATO Benchmark Tool
The ATO provides a free online benchmark tool, no login required. Select your industry, choose your turnover range, and compare the published ratios against your own figures. If you are unsure which industry category applies, your accountant can help you select the right one.
Reviewing Industry Benchmark Tables
Benchmark tables cover different industries and turnover ranges, showing ratios for cost of sales, labour, rent, motor vehicle expenses, and total expenses relative to turnover.
Comparing Your Business Ratios
Calculate your ratios using your financial statements and compare them against the published ranges. If a ratio sits outside the normal range, document the reason and keep supporting records on file.
Working With Accountants or Tax Agents
Many accountants run a benchmark review before lodging Tax Returns to catch unusual ratios early. If you are unsure who to engage, understanding the difference between a tax accountant and tax agent can help you decide who is best placed to assist.
How to Calculate Your Business Benchmark Ratios
To calculate your business benchmark ratios, review your financial statements and determine key figures such as total sales, cost of goods sold, wages, and operating expenses. These figures are then converted into financial percentages using benchmark ratios formulas.
Calculate Cost of Sales Ratio
Formula: Cost of Sales ÷ Turnover × 100
Example: Cost of goods sold $300,000 / Sales $500,000 300,000 ÷ 500,000 × 100 = 60%
Calculate Total Expenses Ratio
Formula: (Total Expenses − Payments to Associated Persons) ÷ Turnover × 100
Example: Total expenses $420,000 / No payments to associated persons / Sales $500,000 420,000 ÷ 500,000 × 100 = 84%
Calculate Labour Ratio
Formula: (Total Salary and Wages + Contractor Expenses − Payments to Associated Persons) ÷ Turnover × 100
Example: Wages $100,000 + Contractor costs $20,000 / Sales $500,000 120,000 ÷ 500,000 × 100 = 24%
Calculate Rent Expenses Ratio
Formula: Rent Expenses ÷ Turnover × 100
Example: Rent $36,000 / Sales $180,000 36,000 ÷ 180,000 × 100 = 20%
Calculate Motor Vehicle Expenses Ratio
Formula: Motor Vehicle Expenses ÷ Turnover × 100
Example: Motor vehicle expenses $25,000 / Sales $500,000 25,000 ÷ 500,000 × 100 = 5%
Compare Results Against ATO Industry Benchmarks
After calculating your ratios, compare them with the benchmark ranges published by the ATO for your industry and turnover size. If any ratio sits outside the typical range, review:
- Income reporting
- Expense categorisation
- Accounting records
It is also worth staying across ATO tax changes for 2026, as updates to reporting rules or thresholds can affect how benchmarks are interpreted for the current financial year.
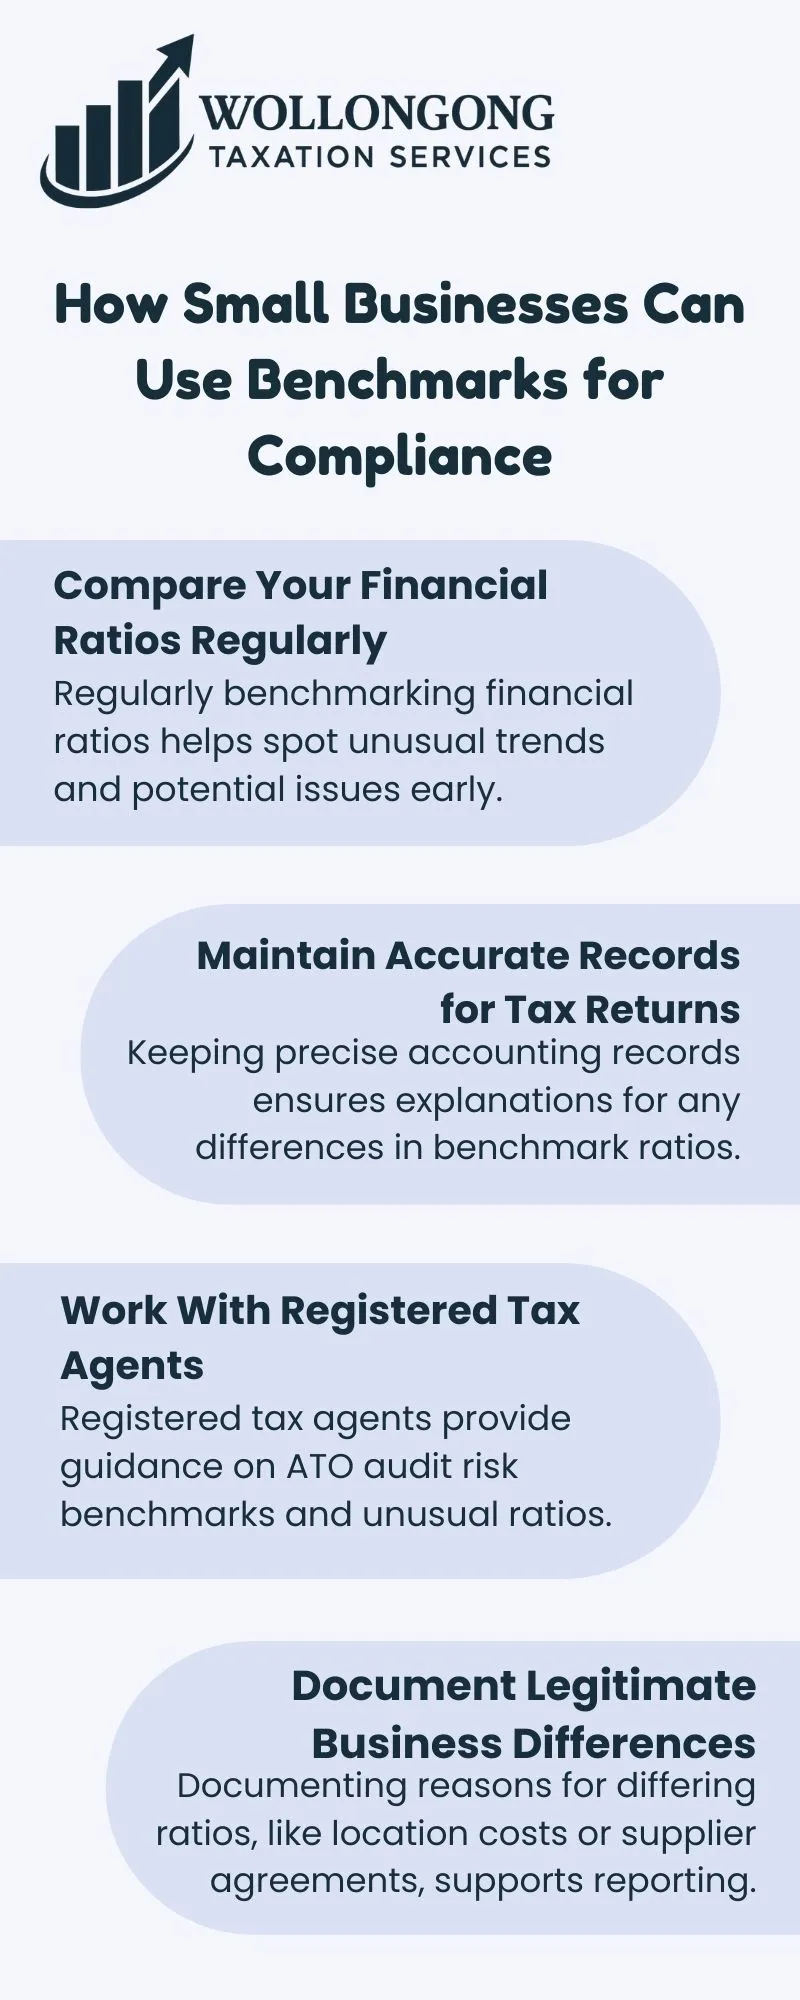
How Small Businesses Can Use Benchmarks for Compliance
Why Understanding ATO Benchmarks Reduces Audit Risk
Businesses that check their ratios before lodging can find and fix problems themselves rather than waiting for the ATO to raise them. The ones that tend to attract reviews are often not deliberate wrongdoers, they are businesses with unreconciled books or missing records that make normal trading look unusual. Knowing your numbers, keeping clean records, and being able to explain any differences puts you in a much stronger position.
Key compliance benefits:
- Improved tax reporting accuracy
- Early detection of bookkeeping errors
- Reduced likelihood of triggering ATO audit risk benchmark
Conclusion
ATO benchmarks are not something to fear. They are a tool, and when you understand how they work, you can use them to your advantage. Check your ratios before you lodge. Keep your records clean. If your figures sit outside the normal range, know why. Small businesses that stay on top of their numbers rarely have surprises at tax time.
If you want help comparing your ratios against ATO benchmarks or preparing your tax return, the team at Wollongong Tax Services is ready to help. Book a consultation today.
FAQs
How do ATO benchmark ratios help small businesses?
ATO benchmark ratios help businesses compare financial performance with similar companies in their industry, identify potential reporting errors, and improve the accuracy of Tax Returns before lodging them.
What happens if a business falls outside ATO industry benchmarks?
Falling outside ATO industry benchmarks does not automatically indicate a problem. Businesses may simply need to review financial records and document legitimate reasons explaining why their ratios differ.
Can ATO benchmarks trigger an audit?
ATO audit risk benchmarks may highlight unusual financial ratios during compliance reviews. However, the ATO usually considers additional information before deciding whether further investigation or audit is necessary.
How can businesses check ATO benchmarks for their industry?
Businesses can review ATO benchmarks Australia through the official ATO small business benchmark tables and compare their financial ratios using accounting records or with assistance from accountants or tax agents.
Are ATO benchmarks mandatory for tax reporting?
No. ATO industry benchmarks are not mandatory rules. They are reference guidelines used by businesses, accountants, and the ATO to assess whether financial results appear reasonable for a specific industry.